
Sales Reporting
Reporting >> Sales shows how your store is selling: revenue, orders, abandoned carts, tax, shipping, refunds, payment methods and coupons. Each figure covers the dates you choose and is compared with the period before them.
Choose the channel and dates
Go to Reporting >> Sales.
If your store has more than one channel, choose a channel, or leave All Channels.
Click the date range at the top right.
Choose a preset, or pick a start and an end date on the calendar.
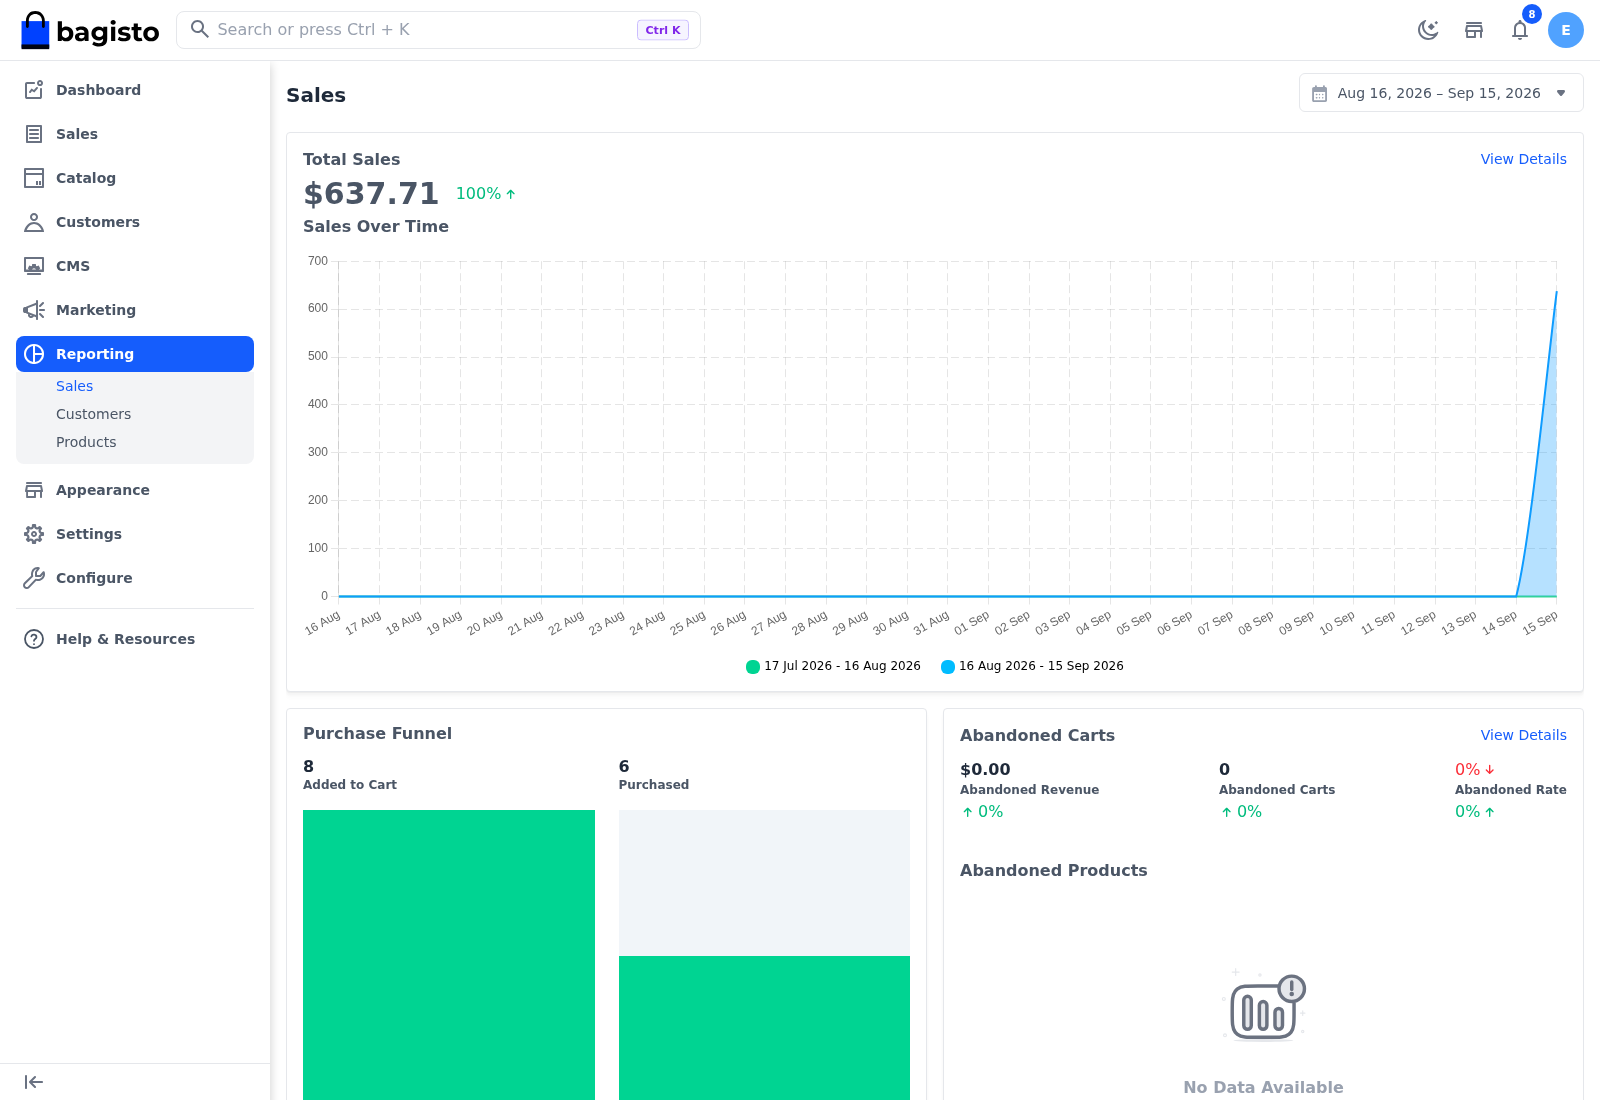
Every card reloads for the channel and dates you chose.
- The report opens on All Channels and the last 30 days.
- The presets are Today, Yesterday, Last 30 Days, This Week, This Month, Last Month, Last 3 Months, Last 6 Months and This Year. Last 3 Months and Last 6 Months end with last month.
- Dates in the future can't be picked.
Reading the cards
- Amounts are in the store's base currency.
- The percentage beside a figure shows how much it changed compared with the period right before your dates. For a single day, such as Today, the percentage isn't a useful comparison.
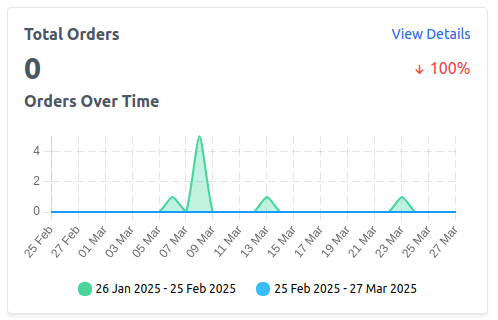
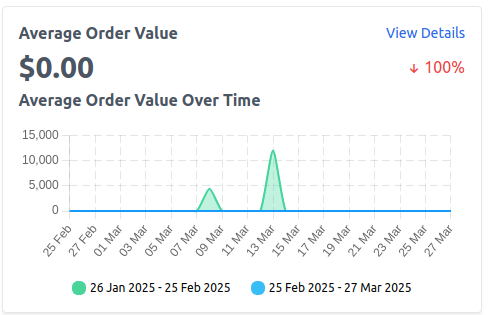
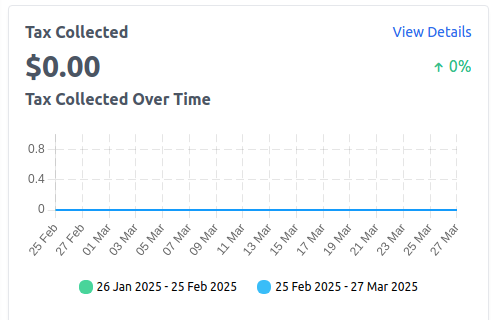
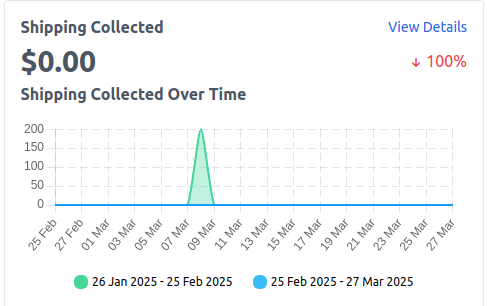
- On a chart, the blue line is your dates and the green line is the period before. The dates of both are shown under the chart.
- Orders are counted by the date they were placed, whatever their status.
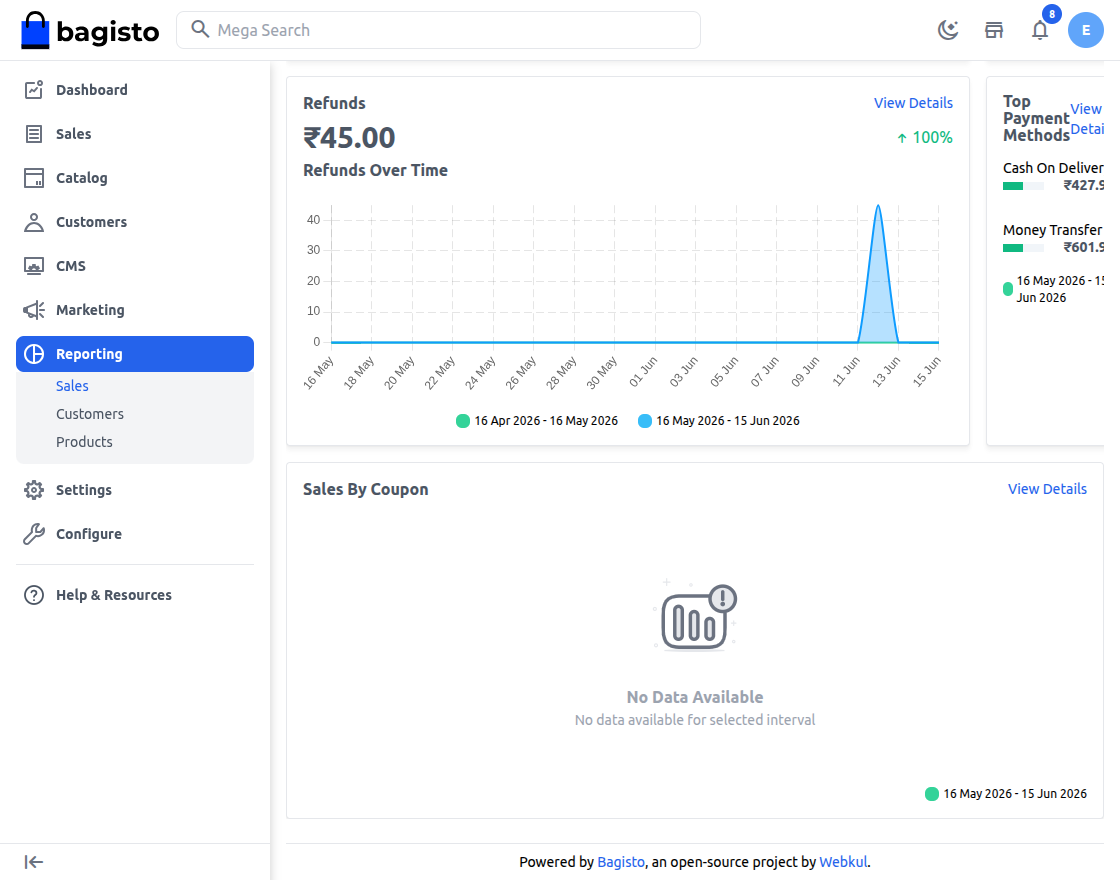
- Lists show the top five. When there's nothing to show, the card says No Data Available.
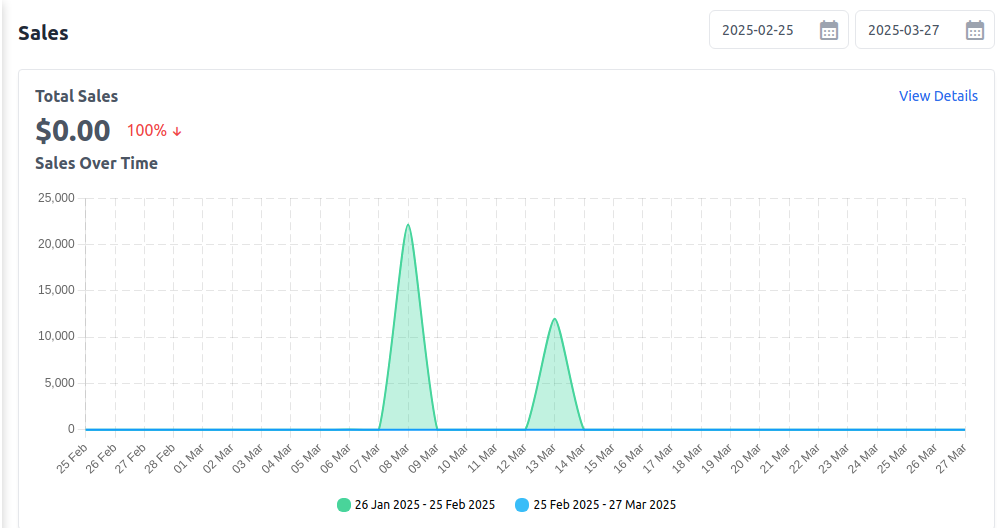
Total Sales
The amount invoiced, minus refunds, for orders placed in the range, with the percentage change and a Sales Over Time chart. Orders that aren't invoiced yet don't add to it.
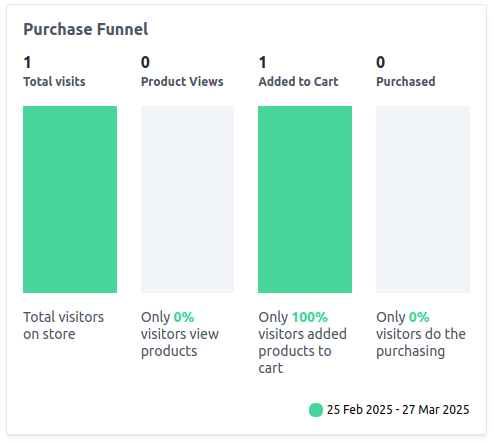
Purchase Funnel
How many shoppers went from a cart to an order in the range:
- Added to Cart: the number of shoppers who created a cart, counted by customer account or email address.
- Purchased: the number of shoppers who placed an order, with the share of cart shoppers who bought (up to 100%).
This card has no comparison and no View Details.
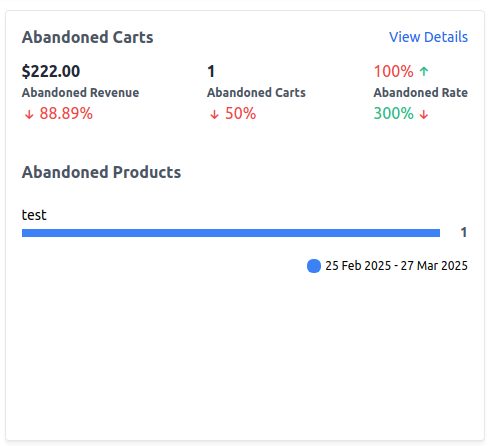
Abandoned Carts
Carts that were never turned into an order. A cart counts only if it's still open and was created at least two days before the end of your dates, so Today and Yesterday show none.
- Abandoned Revenue: the total value of the abandoned carts.
- Abandoned Carts: how many carts were abandoned.
- Abandoned Rate: the share of the carts created in the range that were abandoned.
- Abandoned Products: the five products that appear most often in abandoned carts, with how many times each appears.
Total Orders
The number of orders placed in the range, with the percentage change and an Orders Over Time chart.
Average Order Value
Total sales divided by the number of orders placed in the range, with the percentage change and an Average Order Value Over Time chart. Orders that aren't invoiced yet count as zero and lower the average.
Tax Collected
The tax invoiced, minus refunded tax, with the percentage change and a Tax Collected Over Time chart. Top Tax Categories lists the five tax categories that collected the most.
Shipping Collected
The shipping invoiced, minus refunded shipping, with the percentage change and a Shipping Collected Over Time chart. Top Shipping Methods lists the five shipping methods that collected the most.
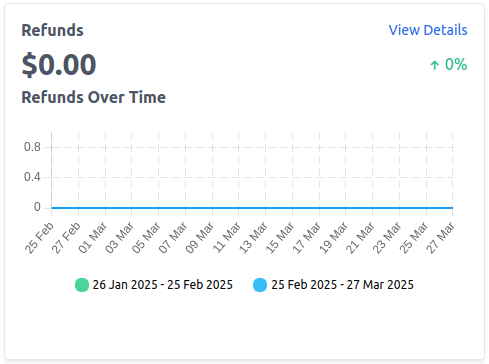
Refunds
The amount refunded on orders placed in the range, with the percentage change and a Refunds Over Time chart.
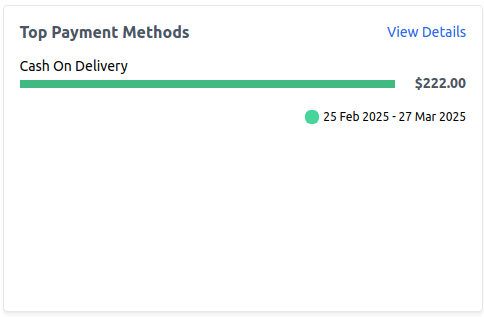
Top Payment Methods
The five payment methods used for the most orders placed in the range, each with the grand total of those orders, whether or not they're invoiced.
Sales By Coupon
The five coupon codes used on the most orders placed in the range, each with the number of orders and the discount invoiced, minus refunds. If the coupon still exists, click its code to open its cart rule.
View details and export
Every card except Purchase Funnel has View Details, which opens the figures as a table.
Click View Details on a card.
If your store has more than one channel, choose the channel.
For a figure over time, choose Day, Month or Year. For totals that cover every date you chose, use Day.
Choose the dates.
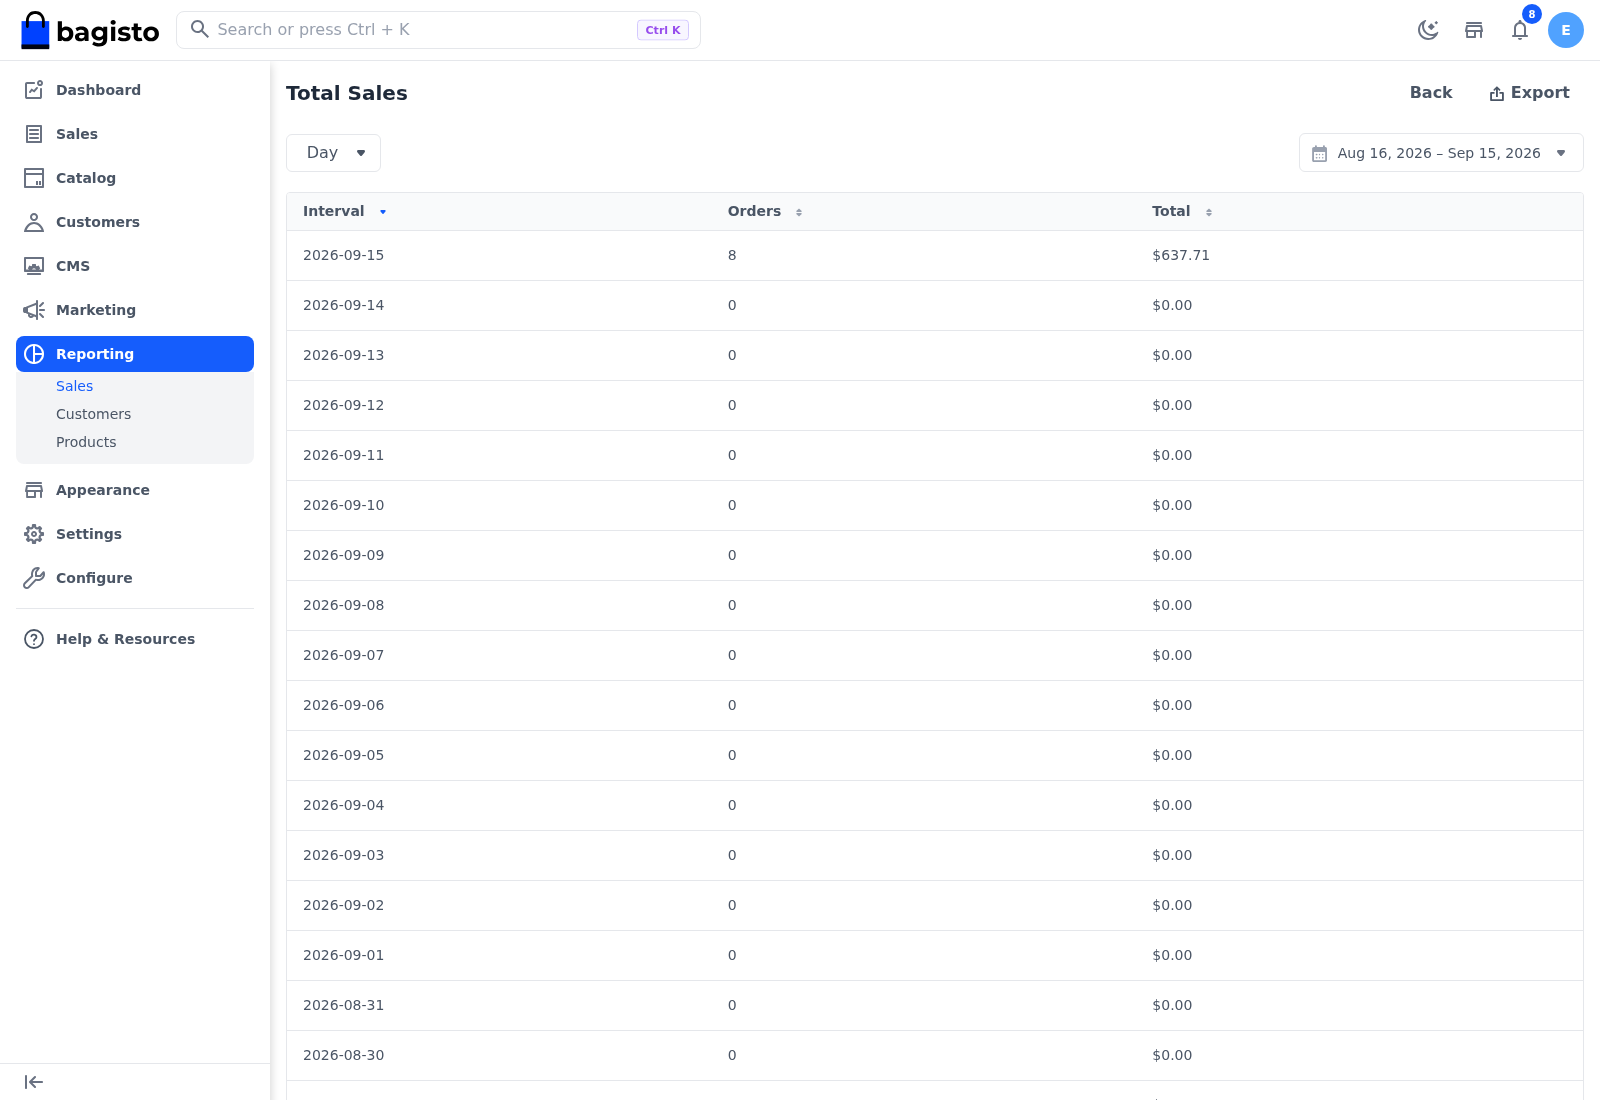
The details page opens on All Channels and the last 30 days, whatever you chose on the report. Click a column heading to sort the table on screen. Back returns to the report.
| Card | Table columns |
|---|---|
| Total Sales, Average Order Value, Tax Collected, Shipping Collected, Refunds | Interval, Orders, Total |
| Total Orders | Interval, Orders |
| Abandoned Carts | Id, Name, Count for each abandoned product |
| Top Payment Methods | Payment Method, Orders, Total |
| Sales By Coupon | Order ID, Coupon Code, Email, Discount, Total, Date, one row for each order, newest first. Order ID and Coupon Code open the order and the cart rule. |
In the tables by interval, Orders is the number of orders placed in that interval, and Total is the card's amount for it (for Average Order Value, the average).
Export the table
- Click Export.
- Choose Export CSV or Export XLS.
The file covers the channel, period and dates chosen on the details page. The exported file keeps the original order, not the order you sorted on screen.
Permissions
A role needs Sales under Reporting to open this report, its details and its export.