# Sales Reporting
Bagisto provides various reports to help store owners track sales, customer behavior, and financial performance. Below is a breakdown of the Sales reporting.
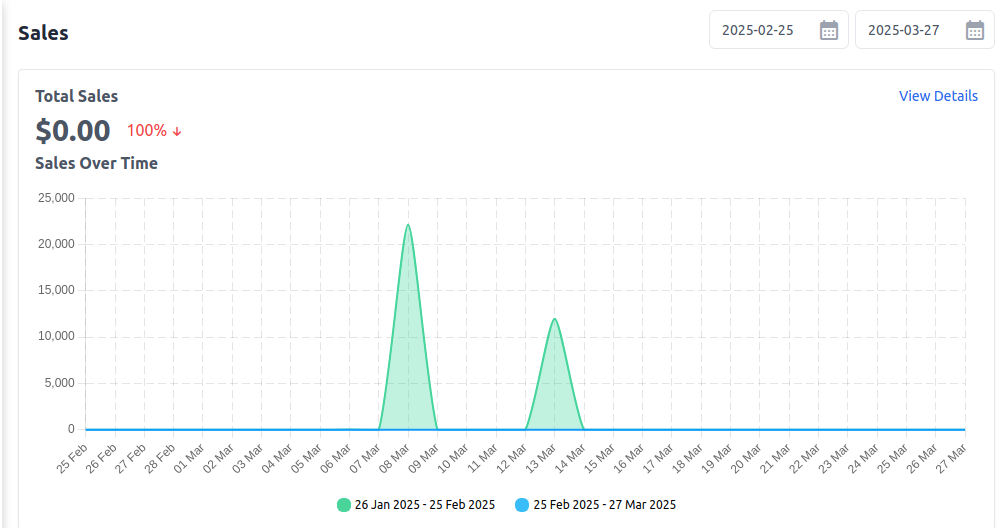
# 1) Total Sales
This report displays the total revenue generated from all orders within the selected date range.
Key Metrics:
1) Total Sales: The total amount earned from completed orders.
2) Percentage Change: Comparison with the previous period.
3) View Details: Click to see a breakdown of individual transactions.
# 2) Sales Over Time
This section provides a graphical view of sales trends over different time periods. It helps store owners analyze sales patterns and seasonal trends.
Key Metrics:
Compare sales between different date ranges.
Identify peak sales periods.
Adjust marketing strategies based on trends.
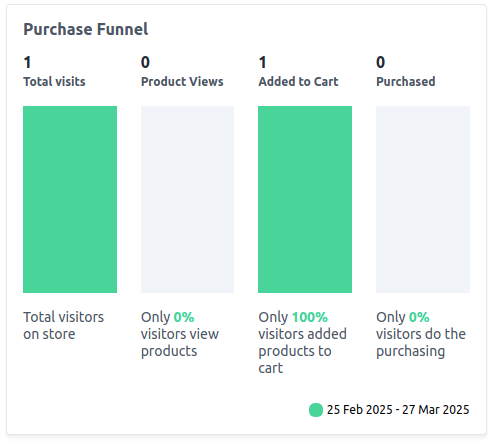
# 3) Purchase Funnel
The purchase funnel tracks customer behavior from visiting the store to completing a purchase. It helps identify where customers drop off in the buying process.
Key Stages:
1) Total Visits – Number of visitors on the store.
2) Product Views – Percentage of visitors who viewed a product.
3) Added to Cart – Percentage of visitors who added a product to the cart.
4) Purchased – Percentage of visitors who completed a purchase.
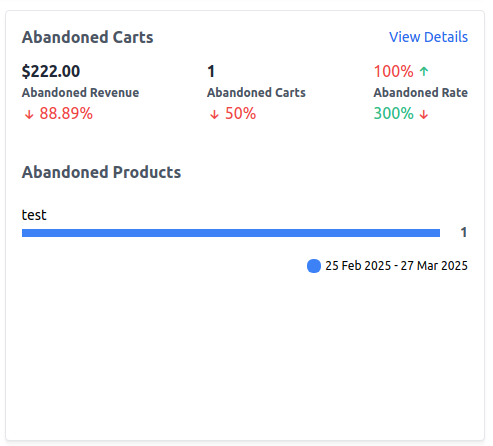
# 4) Abandoned Carts
This report tracks the revenue lost due to customers adding products to the cart but not completing the purchase.
Key Metrics:
1) Abandoned Revenue: Estimated lost revenue from abandoned carts.
2) Abandoned Carts: Number of abandoned shopping carts.
3) Abandonment Rate: Percentage of abandoned carts compared to initiated checkouts.
4) Abandoned Products: Specific products left in abandoned carts.
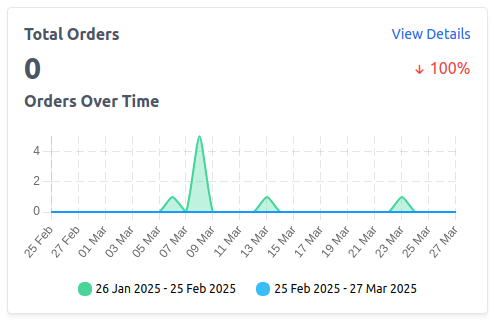
# 5) Total Orders
Displays the total number of orders placed during the selected period.
Key Insights:
Helps track order trends over time.
A decrease in orders may indicate the need for promotional activities.
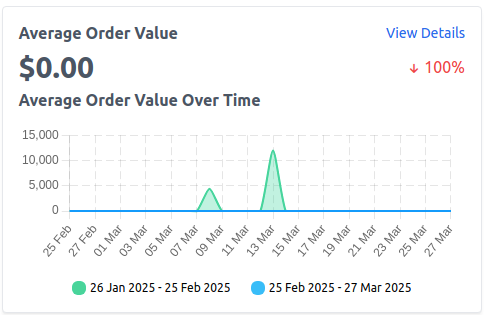
# 6) Average Order Value (AOV)
AOV calculates the average amount spent per order. It helps measure customer spending habits.
Why It Matters
Higher AOV indicates customers are buying more per transaction.
Strategies to increase AOV include product bundling and upselling.
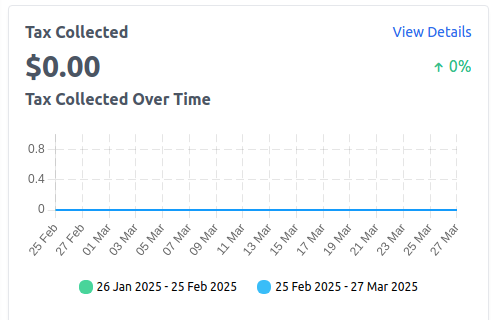
# 7) Tax Collected
Shows the total tax amount collected from orders based on tax rules set in the store.
Key Metrics:
1) Tax Collected: Total tax amount from all sales.
2) Top Tax Categories: Categories contributing the most to tax collection.
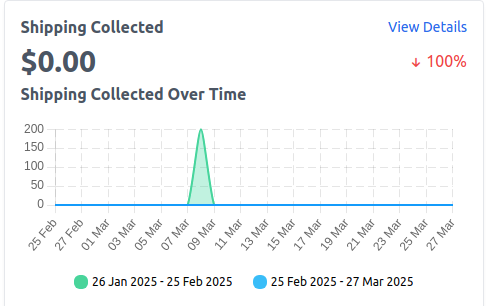
# 8) Shipping Collected
Displays the total amount collected for shipping fees during the selected period.
Key Metrics:
1) Shipping Revenue: Total shipping fees collected.
2) Top Shipping Methods: Most frequently used shipping methods.
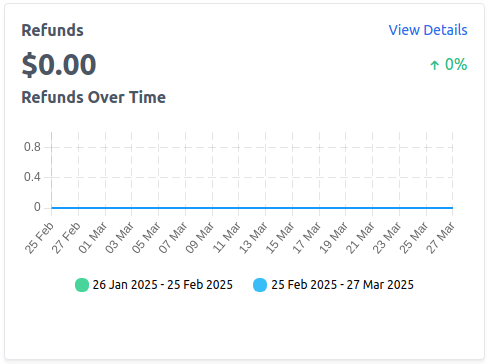
# 9) Refunds
This report tracks the amount refunded to customers for returned or canceled orders.
Key Metrics:
1) Total Refunds: The total amount refunded.
2) Refund Trend: Helps track frequent refund reasons.
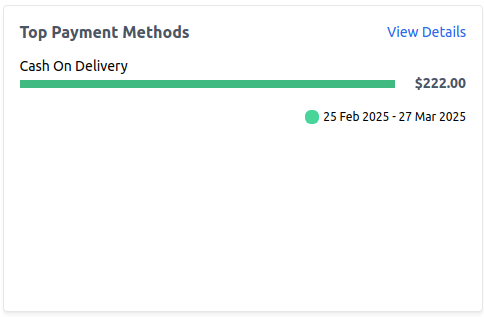
# 10) Top Payment Methods
Shows which payment methods customers use the most.
Key Insights:
If a payment method has low usage, consider offering alternatives.
Helps optimize checkout for preferred payment options.